我的测试doris集群 2fe2be 都是4c16g,数据存储在自建的minio中,部署在同一个K8S集群。
通过paimon外表读取数据
目前试过很多参数的调整,
max_user_connections = 10000
set global exec_mem_limit = '12884901888';
set global enable_query_cache = true;
set global enable_sql_cache = true;
set global parallel_pipeline_task_num = 1;
set global runtime_filter_wait_infinitely = true;
set global enable_snapshot_point_query = false;
-- fe.conf
qe_max_connection=8192
thrift_server_max_worker_threads = 8192
-- be.conf
disable_storage_row_cache = false
enable_warmup_immediately_on_new_rowset = true
enable_file_cache=true
-- 直查doris集群,没有使用接口
500个用户,查询100次
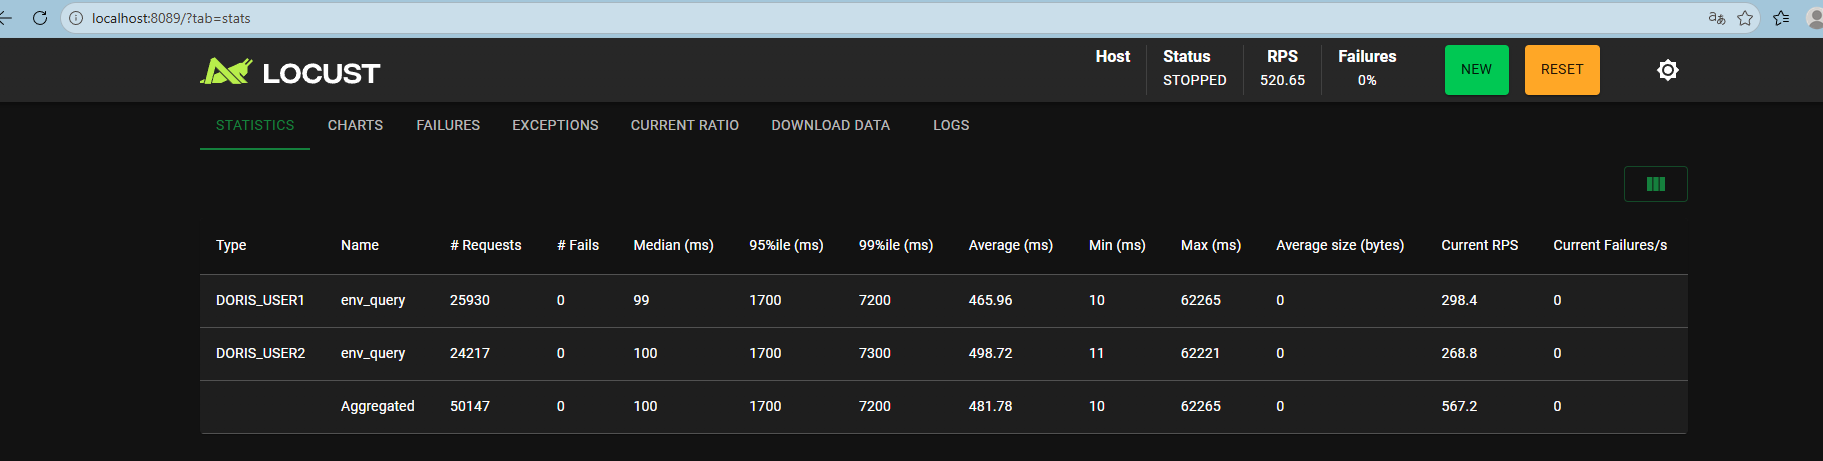
想问一下瓶颈可能在哪个位置?
资源一直都没有跑满。
我发现查询的proflie的 Parse SQL 时间特别长。
会不会这个原因影响呢?
Summary:
- Profile ID: d657bff4a2c44838-92ed3e8a1a1d3cc5
- Task Type: QUERY
- Start Time: 2026-04-30 07:16:13
- End Time: 2026-04-30 07:16:13
- Total: 1ms
- Task State: EOF
- User: query
- Default Catalog: internal
- Default Db: app
- Sql Statement: select * from internal.app.mv_environment_project_hour LIMIT 24
- Distributed Plan: N/A
Execution Summary:
- Workload Group:
- Parse SQL Time: 1sec230ms
- Plan Time: 1ms
- Garbage Collect During Plan Time: -1ms
- Nereids Lock Table Time: N/A
- Nereids Analysis Time: N/A
- Nereids Rewrite Time: N/A
- Nereids Fold Const By BE Time: 0ms
- Nereids Collect Table Partition Time: 0ms
- Nereids Optimize Time: N/A
- Nereids Translate Time: N/A
- Init Scan Node Time: N/A
- Finalize Scan Node Time: N/A
- Get Splits Time: N/A
- Get Partitions Time: N/A
- Get Partition Files Time: N/A
- Create Scan Range Time: N/A
- Distribute Time: N/A
- Get Meta Version Time: 0ms
- Get Partition Version Time: N/A
- Get Partition Version Count (hasData): 0
- Get Partition Version Count: 0
- Get Table Version Time: N/A
- Get Table Version Count: 0
- Schedule Time: N/A
- Fragment Assign Time: N/A
- Fragment Serialize Time: N/A
- Fragment RPC Phase1 Time: N/A
- Fragment RPC Phase2 Time: N/A
- Fragment Compressed Size: 0.00
- Fragment RPC Count: 0
- Schedule Time Of BE: {}
- Wait and Fetch Result Time: N/A
- Fetch Result Time: 0ms
- Write Result Time: 0ms
- Doris Version: doris-3.1.4-rc02-7f5ba43de6
- Is Nereids: Yes
- Is Cached: Yes
- Total Instances Num: 0
- Instances Num Per BE:
- Parallel Fragment Exec Instance Num: 1
- Trace ID:
- Transaction Commit Time: N/A
- System Message: N/A
- Executed By Frontend: N/A
- Splits Assignment Weight: N/A
Changed Session Variables:
| VarName | CurrentValue | DefaultValue |
|---|---|---|
| enable_profile | true | false |
| enable_auto_analyze | false | true |
| enable_snapshot_point_query | false | true |
| parallel_pipeline_task_num | 1 | 0 |
| profile_level | 2 | 1 |
| enable_sql_cache | true | false |
| exec_mem_limit | 12884901888 | 2147483648 |
| enable_query_cache | true | false |
Physical Plan
PhysicalSqlCache[2] ( queryId=1c197fc4c80f4a93-830ccdefea4237cc, backend=doris-disaggregated-cluster-cg1-0.doris-disaggregated-cluster-cg1.data-warehouse.svc.cluster.local:9050, rowCount=24 )
+--PhysicalResultSink[110] ( outputExprs=[stat_day#0, stat_hour#1, project_id#2, project_name#3, wind_speed_min#4, wind_speed_max#5, dswrf_min#6, dswrf_max#7, humidity_min#8, humidity_max#9, pressure_min#10, pressure_max#11, cloudrate_min#12, cloudrate_max#13, visibility_min#14, visibility_max#15, temperature_min#16, temperature_max#17, apparent_temperature_min#18, apparent_temperature_max#19, pm25_min#20, pm25_max#21, pm10_min#22, pm10_max#23, o3_min#24, o3_max#25, so2_min#26, so2_max#27, no2_min#28, no2_max#29, co_min#30, co_max#31, aqi_chn_min#32, aqi_chn_max#33, aqi_usa_min#34, aqi_usa_max#35] )
+--PhysicalLimit[105]@2 ( limit=24, offset=0, phase=GLOBAL, stats=24 )
+--PhysicalDistribute[100]@1 ( stats=24, distributionSpec=DistributionSpecGather )
+--PhysicalLimit[95]@1 ( limit=24, offset=0, phase=LOCAL, stats=24 )
+--PhysicalOlapScan[mv_environment_project_hour]@0 ( stats=13,840 )
有什么方法可以优化呢?

